Projects
A showcase of my work, side projects, and experiments.
A showcase of my work, side projects, and experiments.

This project won 3rd Place in NASA Space App Challenge 2023 Jakarta Local Chapter. Making the way to global nomination.
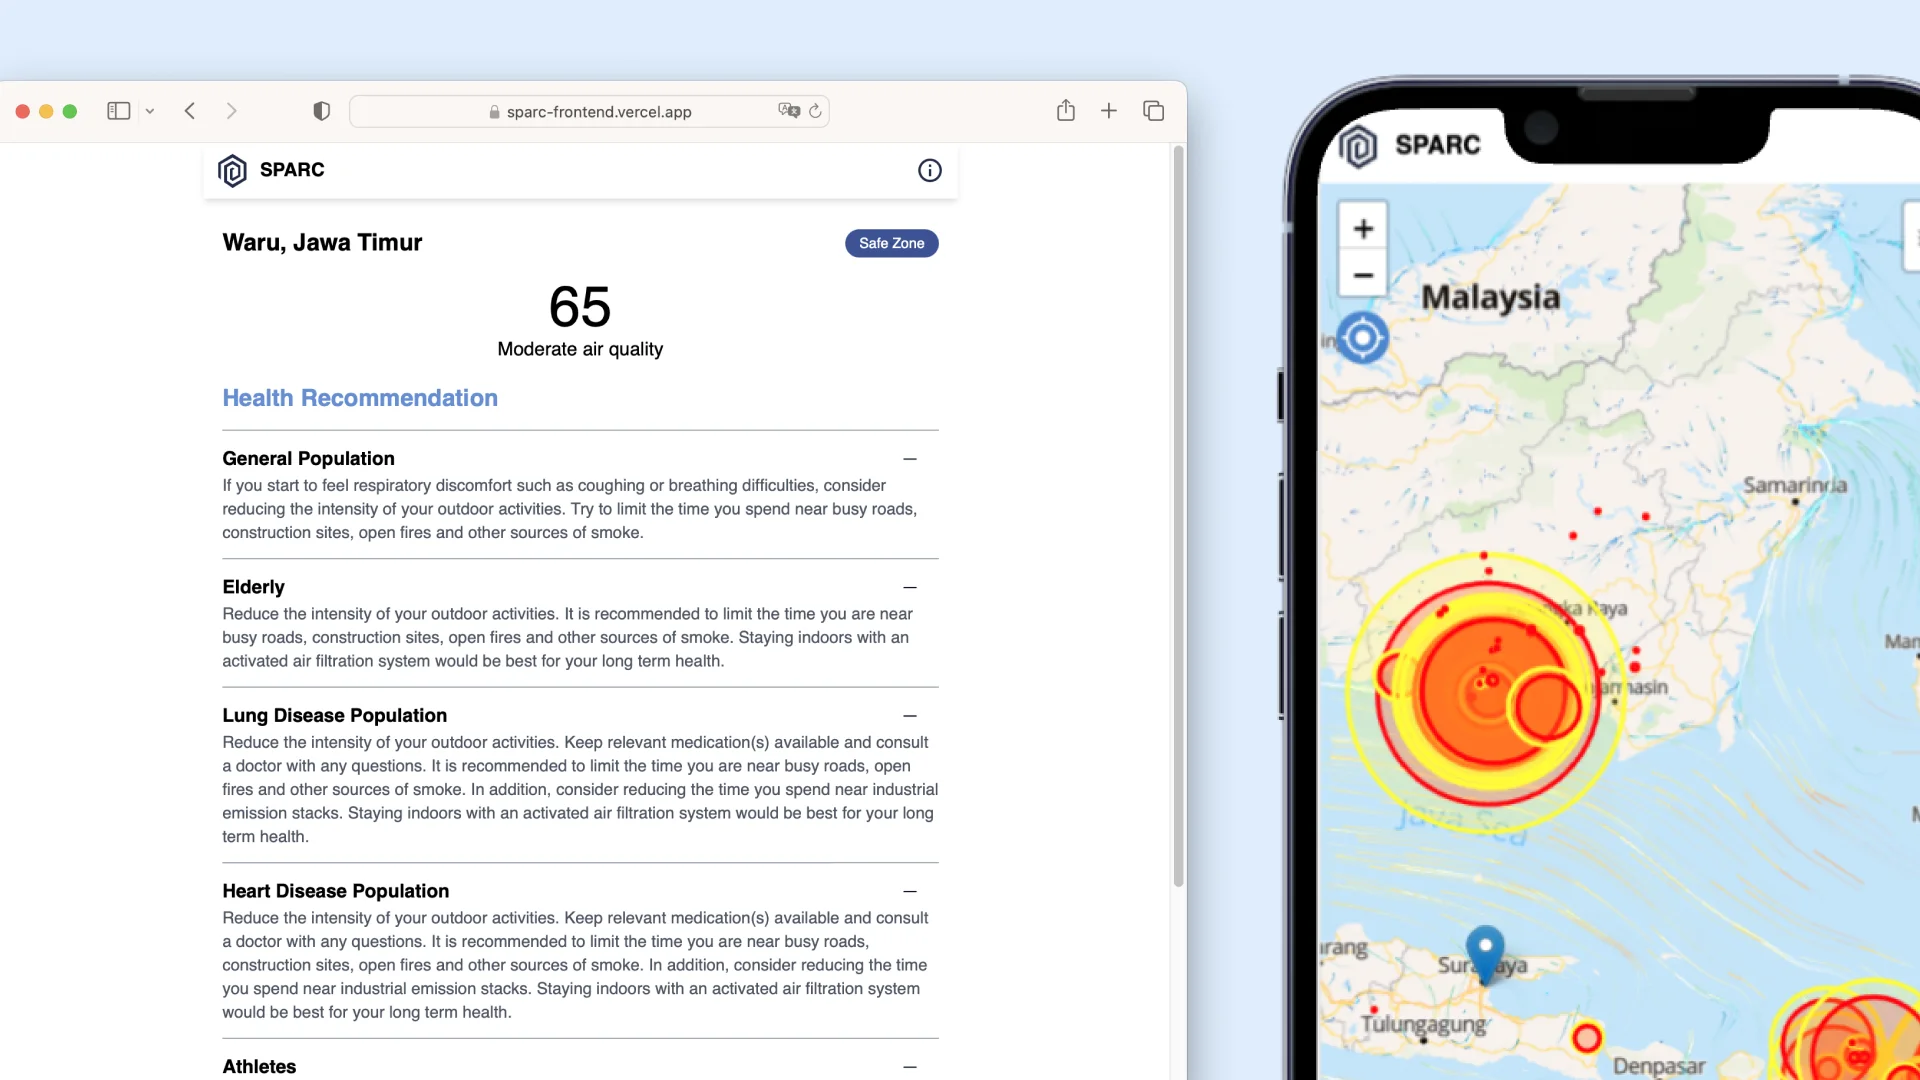
The Canadian wildfires and the “apocalyptic” orange skies of New York this summer is proof that wildfire smoke is a public health crisis. The team aims to solve this issue through our solution, a web-application named SPARC (Smart Predictions and Action for Responding to Wildfire Crises). SPARC enables communities to predict local air quality conditions by predicting wildfire smoke movement using NASA satellite data and other open source data. Communities will be able to know whether a wildfire has occurred near their location, how likely the smoke will reach them, and how to best respond to such a health hazard. As of now, our solution specifically caters to the challenges faced by communities in Indonesia, aiding communities historically prone to wildfires such as those in Kalimantan, Sumatra, and other islands. It provides them with the information necessary to prepare for wildfire smoke and offers health recommendations accordingly.
SPARC uses NASA’s VIIRS satellite imagery data to identify wildfire locations, the United States' NOAA’s Global Forecast Data (GFS) to be processed to retrieve wind direction and velocity, and Google Maps Platform (GMP) from Google Cloud to retrieve local air quality, chemicals, and health recommendations data. There are four main steps we took to build SPARC, namely:
The first step is to collect the necessary wildfire locations data. We used near real-time (NRT) Visible Infrared Imaging Radiometer Suite (VIIRS) data retrieved from the NOAA-20 satellite. This data is then filtered to only the ones with the highest confidence level.
The wind data is analyzed to calculate the wind direction and velocity. This is done by filtering the GFS data to only the wind data, and then calculating the wind direction and velocity from the filtered data. This information is crucial for the smoke simulation, as it determines how the smoke will be dispersed.
The smoke simulation is the next step in the software project. This involves extracting the origin, direction, and velocity of wind from the wind data. The coordinates and intensity of fire are also extracted from the fire data. For each fire location, the nearest point in the wind data grid is determined. The wind component (U and V) for each fire location is then extracted from the wind data grid.
The wind component is adjusted based on the fire intensity, and the dispersal of smoke is calculated according to the wind component. The wind components are then converted into latitude and longitude changes using trigonometric relations.
We use the term “Red Zone”, “Yellow Zone”, and “Safe Zone” to illustrate the impact severity a wildfire smoke could bring to a geographical location. The red and yellow zone coordinates are computed based on the dispersal distance, and the area of the red zone is computed using the formula for the area of a circle.
We retrieve local Air Quality Data from Google Cloud’s Google Maps Platform. This dataset allows us to also retrieve the chemical composition of the air such as PM 2.5 and PM10. In addition, we also managed to extract health recommendations data for a given air quality score in a specific region, so that communities are able to understand what steps to take to reduce side effects from inhaling these hazardous fumes.